


Everything You Need to Know About the IWATSU B-H Analyzer
If you’re working with soft magnetic components and need high-fidelity measurements of B-H curves, magnetic permeability, or core loss, the IWATSU B-H Analyzer represents the gold standard test & measurement system.
Here, B stands for magnetic flux density (T) — think: output, or the material’s response to H — and H stands for magnetic field strength (A/m) — think: input, or the magnetizing force that creates B.
In this guide, we examine the IWATSU B-H Analyzer’s capabilities, compare it with other measurement technologies, and present practical guidance on its use in advanced laboratory and production environments.
What Sets the IWATSU B-H Analyzer Apart?
B-H Analyzer vs. DC Curve Tracer
A DC curve tracer excites samples with slowly varying waveforms. This is ideal for measuring static magnetic properties. However, this method lacks the ability to simulate real-world, heigh-frequency operating conditions.
The IWATSU B-H Analyzer uses high-frequency sine or square wave excitation from a built-in generator, enabling dynamic characterization.
Summary: Use the IWATSU B-H Analyzer when evaluating frequency-dependent properties under realistic load conditions.
B-H Analyzer vs. Impedance Analyzer
An impedance analyzer is typically limited to small-signal testing (currents <100 mA) and is best suited for determining L, Q, R, and Z. In contrast, the IWATSU B-H Analyzer handles both small and large signal levels (5 mA to 6 A) and supports full characterization of core loss and non-linear magnetic behavior.
B-H Analyzer vs. Oscilloscope-Based Systems
While oscilloscopes can be adapted for magnetic measurements, the IWATSU B-H Analyzer delivers:
-
Higher resolution: 16-bit ADCs provide significantly more accurate signal capture compared to 8-bit scopes.
-
Advanced phase correction: Critical for precise core loss measurements, especially with high-loss or powdered materials.
IWATSU B-H Analyzer: Supported Materials and Sample Shapes
The IWATSU B-H Analyzer supports any soft magnetic material that forms a closed magnetic path. Common geometries include:
-
Toroidal cores
-
EE and EI laminations
-
Dust and amorphous cores
-
Motor stators and rotors
-
Laminated stators
With IWATSU’s SY-956 fixture, flat or plate material samples can also be evaluated.
Example Measurement Samples:
EI core
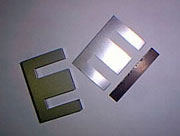
A common laminated core used in transformers and power supplies. Its shape simplifies coil winding and helps reduce eddy current losses.
Dust core
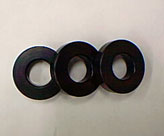
Made from compressed magnetic powder and resin binder, dust cores are ideal for EMI filtering and power inductors due to their distributed air gap and low loss at high frequencies.
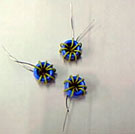
Motor stator
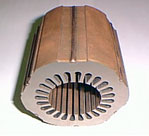
The stationary part of an electric motor that houses the windings. Measuring the stator helps assess performance, losses, and magnetic efficiency in real operating conditions.
Motor rotor
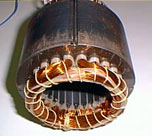
The rotating component inside a motor. Magnetic characterization of the rotor is essential for torque control and motor efficiency.
Amorphous core
Composed of non-crystalline metal alloys, amorphous cores offer extremely low core loss, making them ideal for high-efficiency transformers and power electronics.
Stator laminate
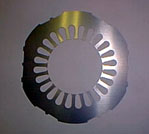
Thin sheets of magnetic steel stacked together to form a stator. Laminated structures are designed to minimize eddy current loss and improve overall energy efficiency.
Measurement Capabilities
Magnetic Permeability
Both amplitude-specific and complex permeability can be extracted using models SY-8218 and SY-8219. Values can be resolved at any point along the B-H curve.
Magnetic Flux Density
The maximum flux density is calculated using:
![]()
Where:
-
= induced voltage
-
= frequency
-
= secondary windings
-
= effective cross-sectional area
For the SY-8218/8219, the max voltage is 200V.
Magnetic Field Strength

Where:
-
= excitation current
-
= primary windings
-
= average magnetic path length
Frequency Range
The measurement frequency range depends on the analyzer model:
| Model | Frequency Range |
|---|---|
| SY-8218 | 10 Hz – 10 MHz |
| SY-8219 | 10 Hz – 1 MHz |
Stable measurements depend not only on model range, but also on LC resonance formed by the sample and analyzer input:
-
Operate at <= 1/10 of LC resonance frequency
-
For samples with phase angles >= 87°, limit to <= 1/20
The resonance frequency can be calculated using the following equation:

Where:
-
: Inductance of the sample
-
: Input capacitance of the analyzer (~18.5 pF for SY-8218/8219)
-
, : Number of primary and secondary windings
⚠️ Tip: When selecting an analyzer or defining your winding configuration, always calculate and apply the appropriate safety margin to avoid resonance-induced measurement distortion.
DC Bias Measurements
Available using IWATSU’s SY-960, SY-961, or SY-962, without the need for tertiary windings.
Pulse Excitation
Default: 10 Hz to 1 MHz, 50% duty cycle. With SY-960 series: 10 kHz to 1 MHz and adjustable duty cycle (10% to 90%).
Arbitrary Waveform Excitation
Supported via external signal generator using the SYNC OUT terminal.
Saturated Flux Density Measurement
Saturated Bm values are measurable if excitation current and voltage remain within the analyzer’s operational limits.
Temperature Characteristics Measurement
Paired with the SY-320A or SY-321A thermostatic systems:
| Feature | SY-320A | SY-321A |
|---|---|---|
| Maximum Samples | 20 | 41 |
| Temperature Range | -30 °C to +150 °C | -30 °C to +150 °C |
| Max Current / Voltage | ±6 A / ±200 V | ±6 A / ±200 V |
| Frequency Limit | Up to 5 MHz | Up to 5 MHz |
⚠️ Note: Actual max frequency is limited by the connected analyzer or amplifier model.
Long-Term Tracking
The optional SY-811 software enables logging for up to ~70 days (99,999 minutes). Ideal for aging and drift studies.
Automated Measurement Program Execution
Remote control with SY-810 software allows full test automation, but the protocol is proprietary.
Power Amplifier Integration
The B-H Analyzer supports dedicated power amplifiers with 4-quadrant output, enabling:
-
Precision DC offset control
-
Accurate B-H curve symmetry
-
Reliable core loss measurements
Using the IWATSU B-H Analyzer without a Power Amplifier
You can use an IWATSU B-H Analyzer without a 4-quadrant amplifier, but extra care is required:
-
Ensure DC offset remains within ±1 V to avoid asymmetry in B-H curves.
-
If you're unable to eliminate the offset, use the optional SY-514 LF AC Coupler, which filters DC components at frequencies ≥ 300 Hz.
Software & Data
A summary of supported accessories and software:
| Feature | Specification |
|---|---|
| Compatible Analyzers | B-H Analyzer SY-8218 / SY-8219 |
| Optional Accessories | SY-320A/321A (Thermal), SY-956 (Plate Tester), SY-960/961/962 (DC Bias) |
| Max Measurement Settings per Sample | 40 (when using SY-320A/321A) |
| Max Temperature Conditions per Sample | 20 (when using SY-320A/321A) |
| Measurement Data Format | CSV |
| Measurement Screenshot Format | JPEG / PNG |
| Supported Operating Systems | Windows 8.1 / 8 / 7 / Vista |
Practical Measurement Considerations
-
Coil Turns: Use ≥3 turns for N1, and match N2 if possible. Avoid N1 < N2 due to resonance risk.
-
Winding Symmetry: Ensure coils are centered and evenly distributed. Use bifilar winding when N1 = N2.
-
Avoid Gaps: The detection coil must adhere tightly to the core to prevent leakage flux.
-
EE Core: Ensure windings do not straddle air gaps.
-
C Core: Wind N2 at one location (positions 1–6), then N1 over N2.
Frequently Asked Questions
i. Why Do Core Loss Measurements Vary with the Number of Windings?
One common reason is LC parallel resonance, which occurs when the sample’s inductance (L) and the analyzer’s input capacitance (C) form a resonant circuit. The resonance frequency is calculated as:

-
: Inductance of the sample
-
: Input capacitance of the analyzer (≈ 18.5 pF for SY-8218/8219)
-
: Primary and secondary windings
To avoid interference, keep your measurement frequency below 1/10 of the calculated resonance frequency—or 1/20 for high phase angle samples (≥87°).
Another possible cause is inhomogeneous field distribution due to sample shape, winding style, or low magnetic permeability, which causes non-uniform magnetic field (H) and flux density (B).
ii. Why Do Current or Voltage Waveforms Become Distorted at High Bm?
Distortion occurs when operating near magnetic saturation, due to the non-linear relationship between and . As the sample nears saturation, the sine wave input becomes clipped or skewed.
iii. What Number of Windings Are Recommended?
IWATSU recommends:
-
Primary coil (N1): 3 or more turns
-
Secondary coil (N2): 1 or more turns, ideally N1 = N2
⚠ If N1 < N2, the system capacitance increases significantly, lowering the resonance frequency and increasing the risk of distortion.
iv. What Is the Correct Way to Wind the Coil?
For accurate measurements, wind coils evenly around the sample to maintain a uniform magnetic field. The detection coil should tightly adhere to the core to avoid flux leakage. If coils overlap, wind the detection coil first. When both coils have the same number of turns, bifilar winding is recommended—it improves coupling and reduces leakage flux compared to separate windings.

Uniform and tight winding is key:
-
Distribute turns evenly to ensure consistent magnetic field strength.
-
Ensure the detection coil adheres to the sample to prevent flux leakage.
-
If coils overlap, wind detection (N2) first.
-
If N1 = N2, consider bifilar winding for superior coupling and reduced leakage.
v. How to Wind an EE Core

-
Ensure N1 and N2 do not straddle the air gap.
-
Maintain symmetry to balance magnetic paths (Le1 = Le2).
vi. How to Wind a C Core

-
Wrap N2 on a single location (positions 1–6)
-
Wrap N1 over N2 for optimal coupling between excitation and detection coils
vii. Why Are 3 Turns Recommended Instead of 1 or 2?
A single turn concentrates the magnetic field in one spot, leading to uneven excitation. Two turns improve distribution across opposite sides, but misalignment with the sample’s center causes imbalance. With three turns, the coil is more symmetrically centered, resulting in a nearly uniform magnetic field. The illustration below demonstrates:

-
1 Turn: Highly localized field, inconsistent measurement
-
2 Turns: Some balance, but misaligned center
-
3 Turns: Optimal symmetry and uniform magnetic field coverage
viii. What Range of Magnetic Flux Densities Can Be Measured?
In the unsaturated region, the maximum flux density is related to the induced voltage by:
![]()
Where:
-
: Frequency
-
: Secondary turns
-
: Effective cross-sectional area
For SY-8218/8219, max = 200V.
Start at 50–75% of the target to prevent damage, then gradually increase excitation.
ix. Why Is My B-H Curve Reversed?
A reversed B-H curve—where right/left or top/bottom positions are swapped—can occur if the coil connections are made incorrectly.
In the example below, the left B-H curve is inverted, while the right curve is correct:

This inversion happens when the primary and secondary windings are connected with reversed polarity. The analyzer interprets the applied magnetic field (H) and the resulting flux density (B) with opposite sign, flipping the display.
To avoid this:
-
Identify the start and end of each winding before connecting to the analyzer.
-
Keep winding direction consistent between primary (N1) and secondary (N2).
-
Follow the analyzer’s polarity markings (e.g., P1/P2 for primary, S1/S2 for secondary).
-
If the displayed B-H curve appears mirrored, try swapping either the primary leads (P1 ↔ P2) or the secondary leads (S1 ↔ S2)—but not both.
Correct polarity ensures the analyzer measures H and B in the same phase relationship, producing an accurate B-H curve.
Advanced Questions & Special Applications
This chapter explores complex real-world questions about B-H Analyzer usage, best practices for specific setups like chip inductors, and how core shape or coil configuration can influence results. It includes key equations, expert insights, and example visuals.
What Magnetic Field Strength Can Be Excited?
The maximum magnetic field strength is determined by:
![]()
Where:
-
: Excitation current
-
: Number of primary windings
-
: Magnetic path length
The maximum current depends on the output of the power amplifier in use.
Measuring Core Loss Including Copper Loss
Yes, using the 1-coil method (no secondary detection coil), the analyzer measures total loss including core loss + copper loss of the primary winding. This setup is ideal when dual-winding is not feasible.
⚠️ Note: Use I1m and Hm as measurement parameters, not V2m or Bm, due to loss from shunt resistance.
Thermostatic Chamber Precautions (SY-320A/321A)
-
Keep your sample ≥15 mm away from the SY-510/511 turntable to prevent eddy current loss from aluminum.
-
If your sample is conductive or emits strong leakage flux, maintain even greater distance to avoid measurement error.
SY-956 Small Plate Device Tips
-
Avoid any gap between the yoke and the sample—leakage flux skews results.
-
Minimize voids between the B coil and sample to block geomagnetic flux and leakage.
DC Bias Tester (SY-960) Inductance Limit
SY-960 can measure samples with inductance up to several tens of µH.
Higher inductance may cause power amplifier output to be diverted into the DC bias source, making readings invalid.
Variability in Measured Core Loss
This can result from:
-
Temperature Instability: Magnetic properties (especially in ferrite) change near room temp. Always use a thermostatic chamber.
-
Excitation History: Some materials shift properties over time. Use SY-811 for long-term tracking up to 99,999 minutes (70 days).
Different Shapes Yield Different BH Curves
Even if made from the same material, different core shapes produce different flux distributions.
Magnetic flux follows paths of least reluctance, so local variations in density arise, causing shape-specific hysteresis behaviors.
Phase Angle & Deskew Calibration
Users cannot self-calibrate phase shift between voltage (secondary) and current (primary).
Only Iwatsu’s factory can perform this with proprietary calibration methods.
-
Phase is stable in controlled temperature environments (optimal: 23°C ±5°C)
-
Performance is consistent for over a year without drift
Overlaying Multiple BH Curves
While the IWATSU mainframe can show two BH curves at once, all measured data can be exported and overlaid externally (e.g., in Excel):

This example shows hysteresis loops over varying frequency (50 kHz to 70 kHz) and values (100 mT to 400 mT).
Calibration Cycle Recommendation
-
Official recommendation: 1 year
-
Research use: Many customers operate longer due to the system’s high stability
Chip Inductor Measurements
Chip inductors pose unique challenges due to their small size and often unknown dimensions.

Input Assumptions:

-
If dimensions are unknown, assume:
-
Le = 10 mm, Ae = 10 mm² for ~10 mm chips
-
Le = 1 mm, Ae = 1 mm² for ~1 mm chips
-
Since exact values are unknown, B and H values are relative and cannot be compared across different core geometries.
Simulation & µ-Mode for Chip Inductors
Use µ-mode instead of normal mode, as it unlocks:
-
More measurable parameters
-
Validation via L values
-
Better control over current vs. frequency changes
 Example: Current vs. Frequency Consideration

When increasing frequency, I1m decreases (inversely proportional). For stable analysis, fix I1m instead of V2m.
How is V₂ Related to Bₘ?
When calculating the peak induced voltage from your desired magnetic flux density :
Where:
-
: Frequency
-
: Secondary turns
-
: Max magnetic flux density
-
: Effective core area
⚠️ Note: Measured voltage may be 3x to 10x higher depending on the sample’s saturation state. Always begin with 50–75% of target and increase gradually to avoid damage.
Conclusion
The IWATSU B-H Analyzer is a precision instrument engineered for professionals who require repeatable, high-resolution magnetic characterization across a broad frequency range. Whether for R&D, qualification, or production test, its capabilities are unmatched in the field.
For more information or a quote, contact sales@pmkamerica.com.


